Maps can provide a wide range of valuable information and insights about the world around us – ranging from geographical, to political, cultural, and environmental information. And they are powerful spatial planning tools that provide a visual and data-rich foundation for decision-making. Researchers from the LDE PortCityFutures centre developed a standardised method for mapping 100 port city territories, creating a book that can contribute to the future of port territories through education, planning and design.
Through TU Delft OPEN Publishing, they recently published Port City Atlas: Mapping European Port City Territories: From Understanding to Design. Co-author Yvonne van Mil shares about the value of maps and mapping, how this project came to life, and what’s next.
Mapmaking as a tool
As a researcher in spatial history & geospatial mapping at TU Delft’s Faculty of Architecture and the Built Environment, Yvonne van Mil said her research centres on spatial narratives. She uses maps and mapmaking as tools for conducting her research. “You can use maps as a source for your research, as input for a debate, but also to present your design or research result, or to support or clarify a narrative that you want to tell,” she said. “A map is a very strong communication tool, but the process of mapmaking in GIS is a way of doing research. It is a way of analysing spatial structures.” She added that by selecting, interpreting, combining, and extracting data, you can discover interrelationships between spatial, social, and cultural aspects. Much of van Mil’s work focusses on mapping urban landscapes and port cities.
Mapping port cities
A port, the neighbouring city, and the surrounding landscape together create a unique zone where land and water meet, facilitating the movement of people, commodities, and concepts. While a port and its associated infrastructure are integral components of a globally interconnected industrial system, they are constrained by the limited space they share with their urban surroundings and conflicting interests in the broader region. So when it comes to ports, maps can play an important role in understanding, planning, and designing to meet evolving needs.
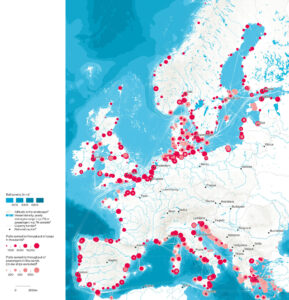
Conceived as a work of reference, the Port City Atlas project aimed to study the complexity of the ports that dot Europe’s coastline. The book is the first part of a series on mapping port cities, spearheaded by the LDE PortCityFutures research group, an interdisciplinary collaboration between the University of Leiden, TU Delft, and Erasmus University.
The standardised mapmaking process
Creating the Port City Atlas book is really about mapmaking as a process, said van Mil. But it is also about using the maps for a common form of communication. “Using maps and mapmaking for research is not per se new, and neither is the research into port cities,” she said. “But what we did for this book is develop a method for mapping 100 port city territories in a standardised way, so that it allows for comparison.” That means they created 100 maps that have the same scale, the same data layers, and the same legend, combined with a standardized infographic page showing data on the port city territory. “That is what makes this book special, because most researchers focus on case studies, but this goes beyond the case study approach. We studied the port city on different scale levels and used many types of data; quantitative data on throughput, population numbers and densities, and qualitative data on spatial features such as land cover and infrastructure, but also UNESCO and Natura2000.”
Visual and totally open
The book gives a broad overview of European port city territories, which van Mil said is a good starting point for students, policy makers, or planners. And although it wasn’t necessarily the plan, the project ended up being largely open-sourced. The team exclusively used European open access data sets, as van Mil said because national or local data is not always freely accessible and often difficult to compare because each dataset has its own definitions and criteria. And the software that was used was also open source. But one of the challenges with this type of book was that it was costly to create something so visual. “I think it’s rare for a book with more than 120 unique maps to be open access,” said van Mil. “It’s great that we have funds like NWO Open Access as well as groups like TU Delft OPEN Publishing who can support us and still make this book open access for a lot of people.”
Starting point
As one of three authors on the book project, van Mil pointed out that they didn’t do the work alone. She worked with a group of enthusiastic student assistants and PhD students who helped with the huge task of making so many maps. “The students were really positive about the experience and for them, mapping was a really nice and active way of conducting research,” she said.
And this book is just a starting point for van Mil and the PortCityFutures team. “We’ve set up this research methodology, and we want to continue with this. We already started with a follow up of this atlas that’s about river port city territories. We want to continue with more thematic, more in depth follow up studies based on this mapping approach. We already have some analytical insights from our research, but there’s much more knowledge in this book. So we also want to go more in depth and tell the stories that are in these maps and data.”